
Predicting 2026 Team Strength... and Strength of Schedule
The going is about to get tough
College baseball has its share of dynasties and juggernauts. But with only so many years of eligibility, players getting picked off by the MLB draft, and now the possibilities of transfers, last year’s conference champ could struggle to crack .500.
How, then, do we predict team strength before the season even starts?
If we really wanted, we could calculate a version of WAR for every returning player, do the same for incoming transfers (adjusted for level and park, of course), work some kind of magic to assign stats to incoming freshmen, then plug all that into a depth chart, ZiPS-style. We’ve done it: It relies on so many assumptions that simply going through the process illustrates how fragile it is.
Then there’s the easy way. Since 2021, the team-strength (SRS) correlation from one year to the next is about 0.85. Multiply last year’s strength-rating by 0.85 and—voila!—you have a pretty good estimate of how the team will look in 2026.
(The regression is a bit more involved than multiplying by 0.85, but it’s so close that it’s barely worth bothering.)
Here’s what the 2026 predictions look like:
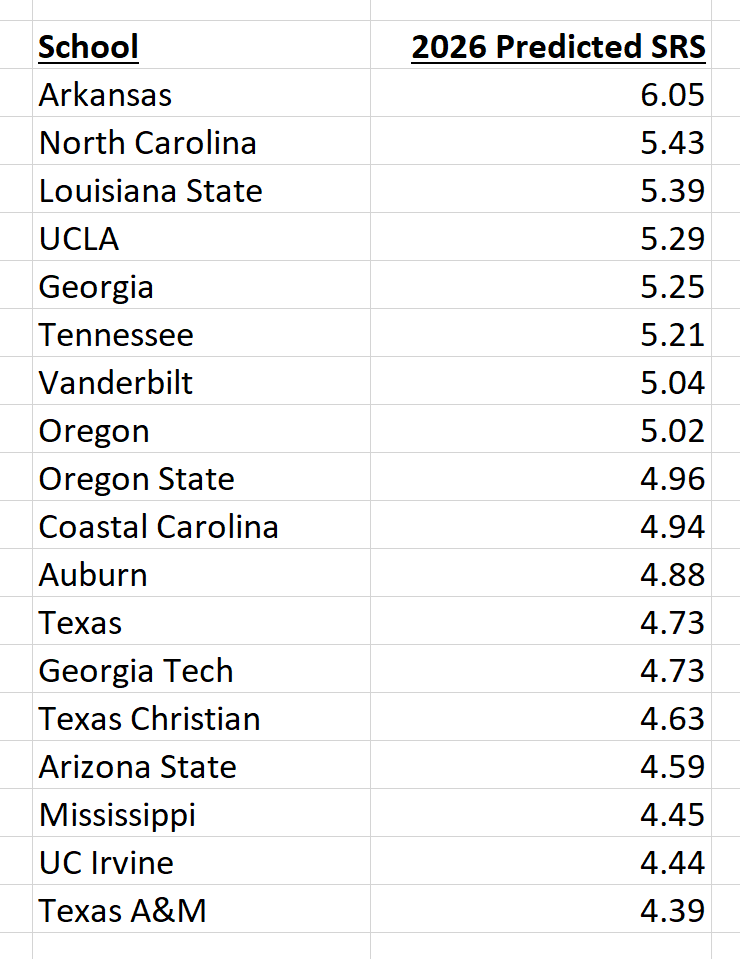
I’ll admit, this is not the most interesting list. The ordinal ranking is almost identical to the 2025-year-end strength ratings: If you take a list of numbers and multiply them all by 0.85, the order doesn’t change. Only the gap between them shrinks.
There are some ways to split the difference between ZiPS-style complexity and the fourth-grade math that I’ve done here. We could calculate correlations and make adjustments on a conference-by-conference basis. We could estimate the impact on team strength of things like losing players to the draft, or having a particularly high or low number of returning players.
These approaches might help us identify the teams most likely to see big improvements or declines. But for the majority of schools, the dead-simple method is probably good enough.
Strength of schedule
While the predicted strength ratings are a little boring, they do prove useful.
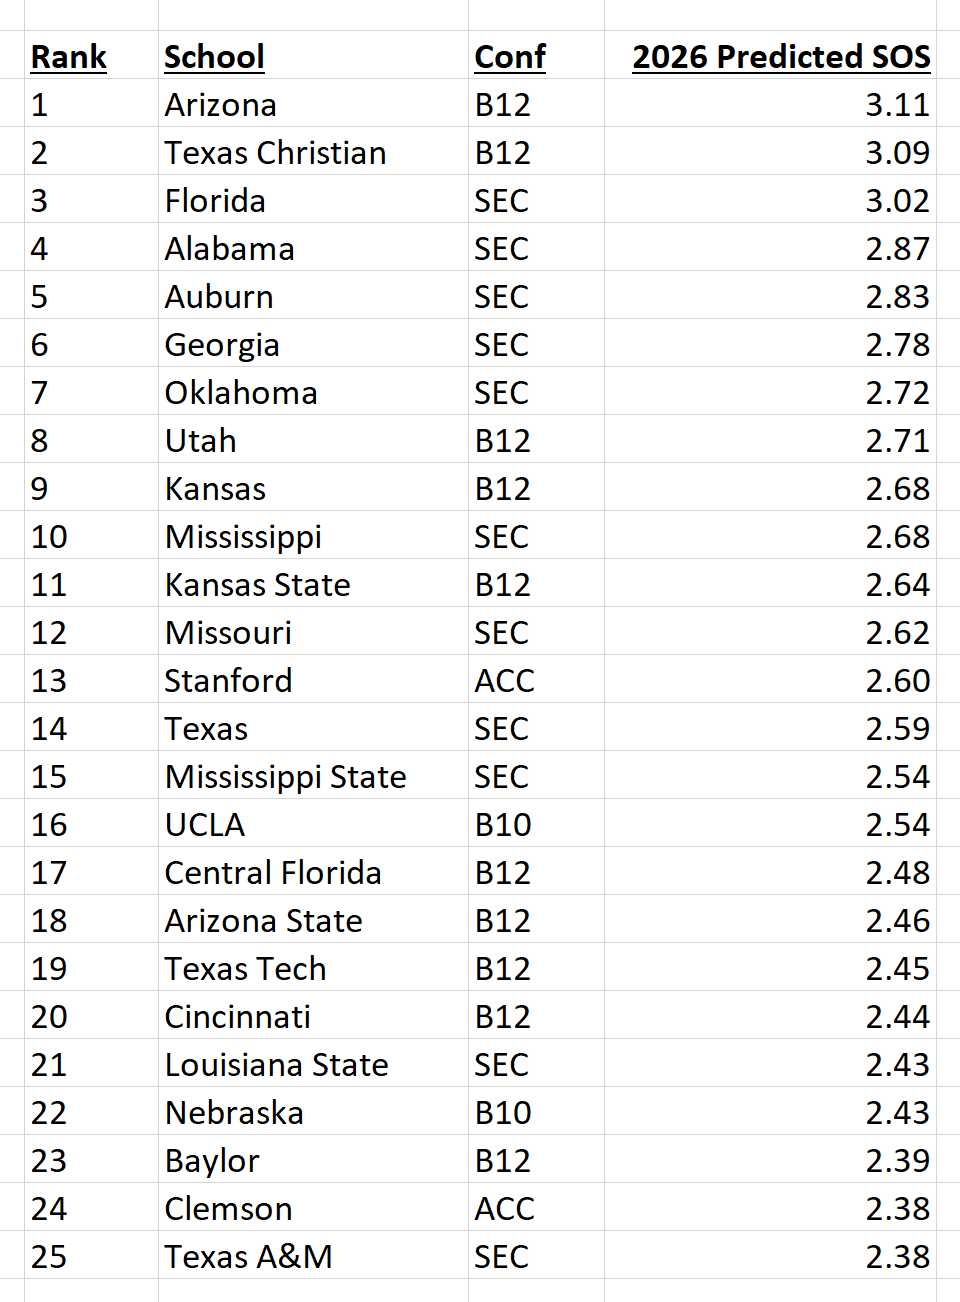
Combine those ratings with every team’s list of upcoming opponents, and we can forecast strength of schedule!
The SEC will likely remain the strongest league, yet two Big 12 clubs are set to face the most challenging regular-season slates:
And here’s the next 25. You can see where Oregon State fits in, and also spot the toughest schedules outside of the Power 4:
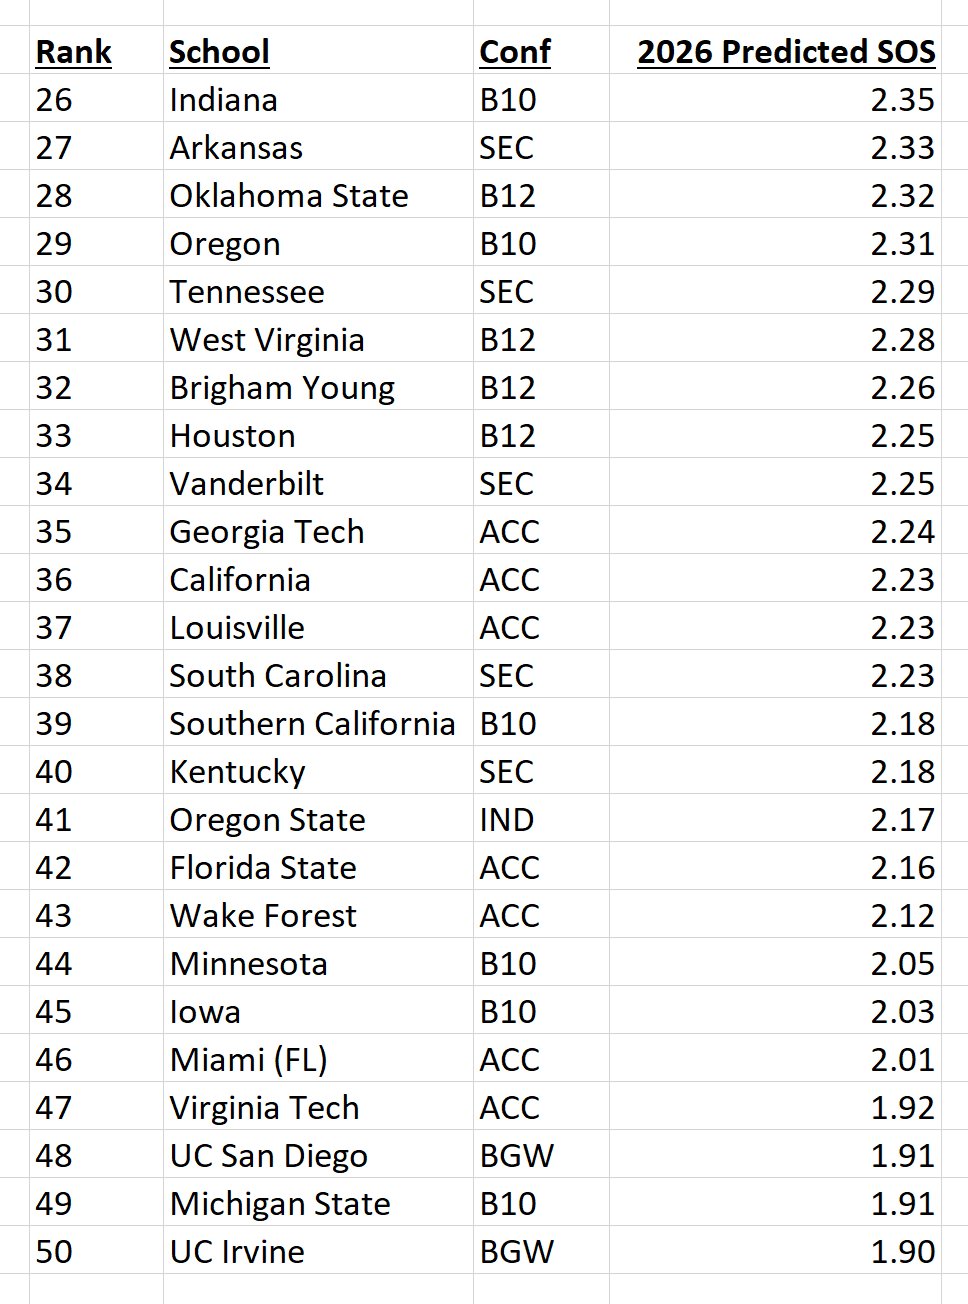
In their awkward position as an independent, Oregon State still managed to put together a P4-quality schedule, though it is on the lower end of that scale. A few P4 schools are much further down the list: Purdue and Virginia both have projected SOS ratings of about 1.1, barely inside the top 100.
Of course, these are approximations. It’s kind of silly to show these numbers to two decimal places—even one decimal place implies that we know better than we do how the season will play out. Still, there’s something here, a general idea of the road each team has to travel for the next three months.
We don’t have long to wait to see how these figures will shift. Arizona opens tomorrow against Stanford, while TCU faces a daunting weekend trio of Vanderbilt, Arkansas, and Oklahoma. The tough are about to get going, and we’ll be here to measure it all.